Audiences for Climate Communications


2023-11-29
There is a big opportunity for engaging people with climate change-related content outside of news and politics, which is where most climate change-related communication currently occurs. In this post, we share how we know this, both our findings and our methods.
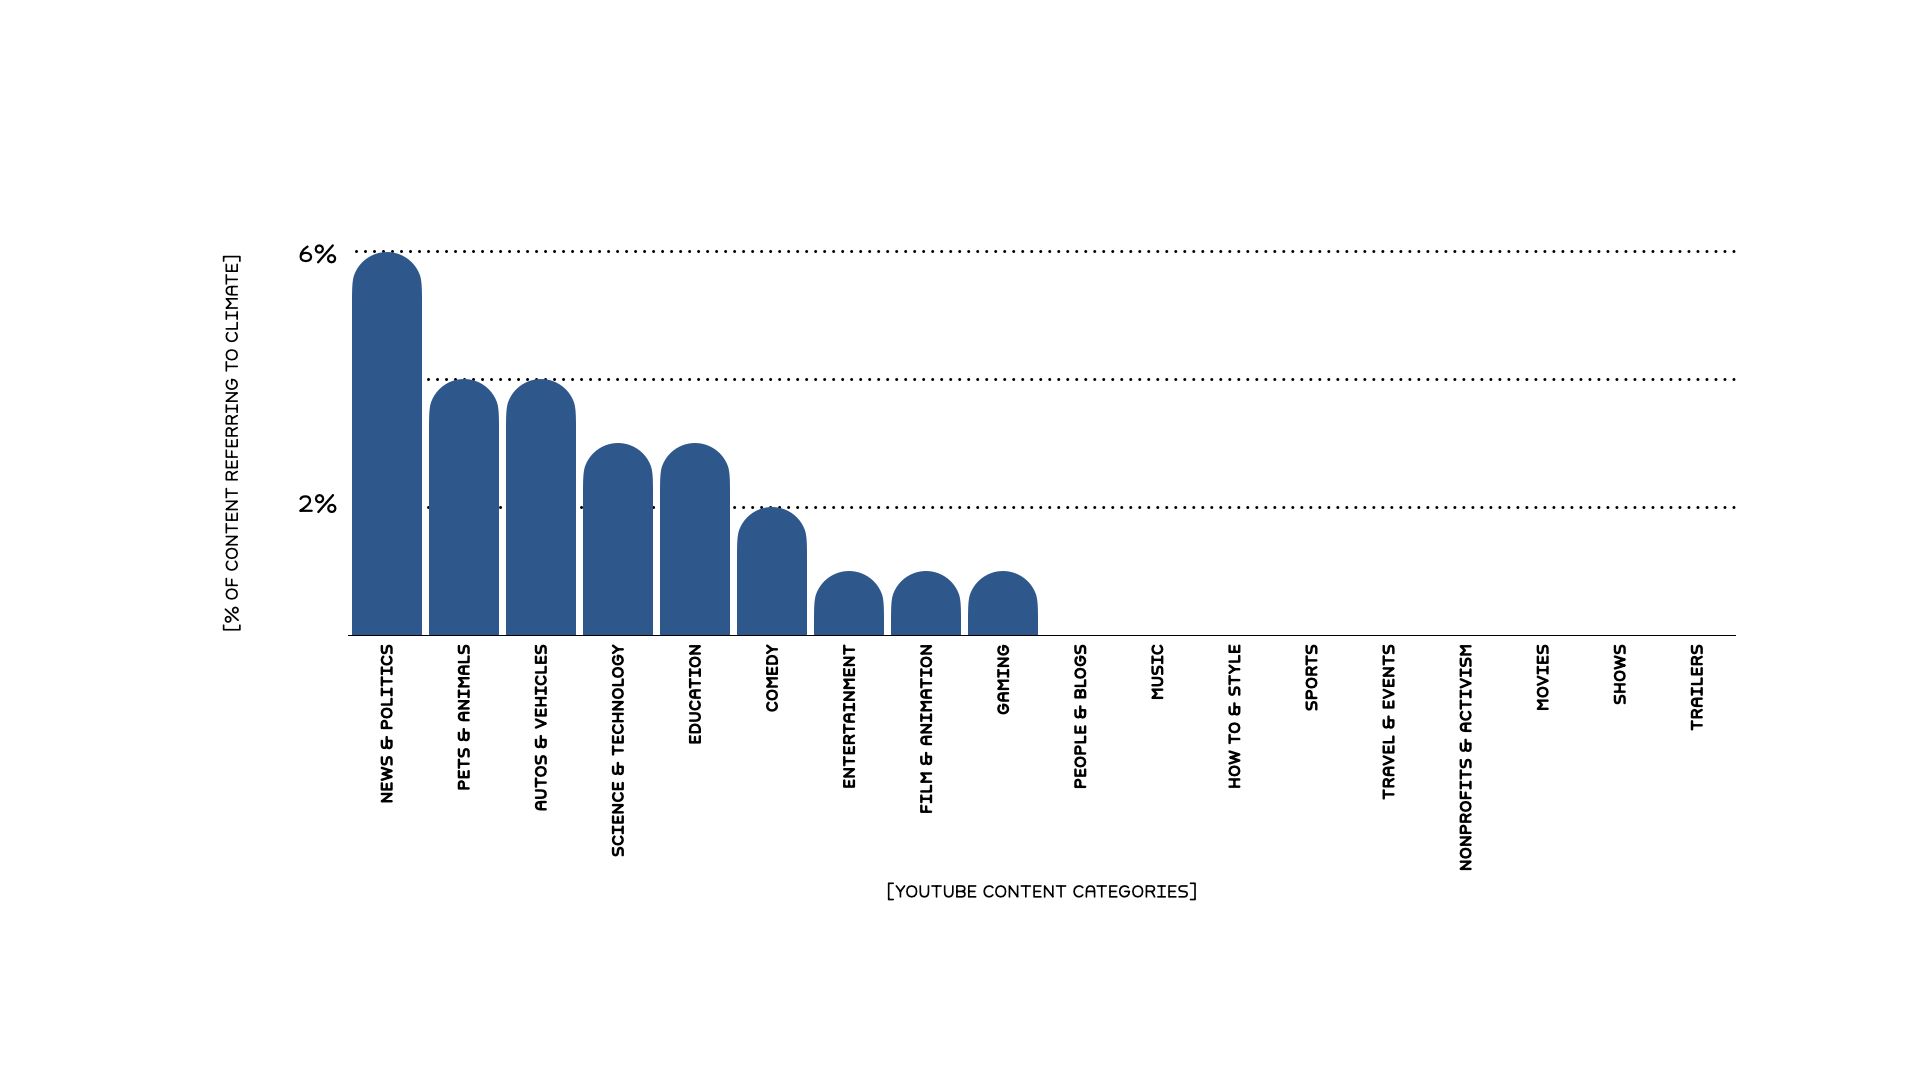
When we looked at YouTube in a single week of 2023, climate change as a topic was about five times as likely to reach platform users via news and politics than via other content categories.
This finding lines up with findings from other researchers. Good Energy and USC’s Norman Lear Center recently found, for example, that climate change keywords in scripted entertainment between 2016 and 2020 were vanishingly rare.
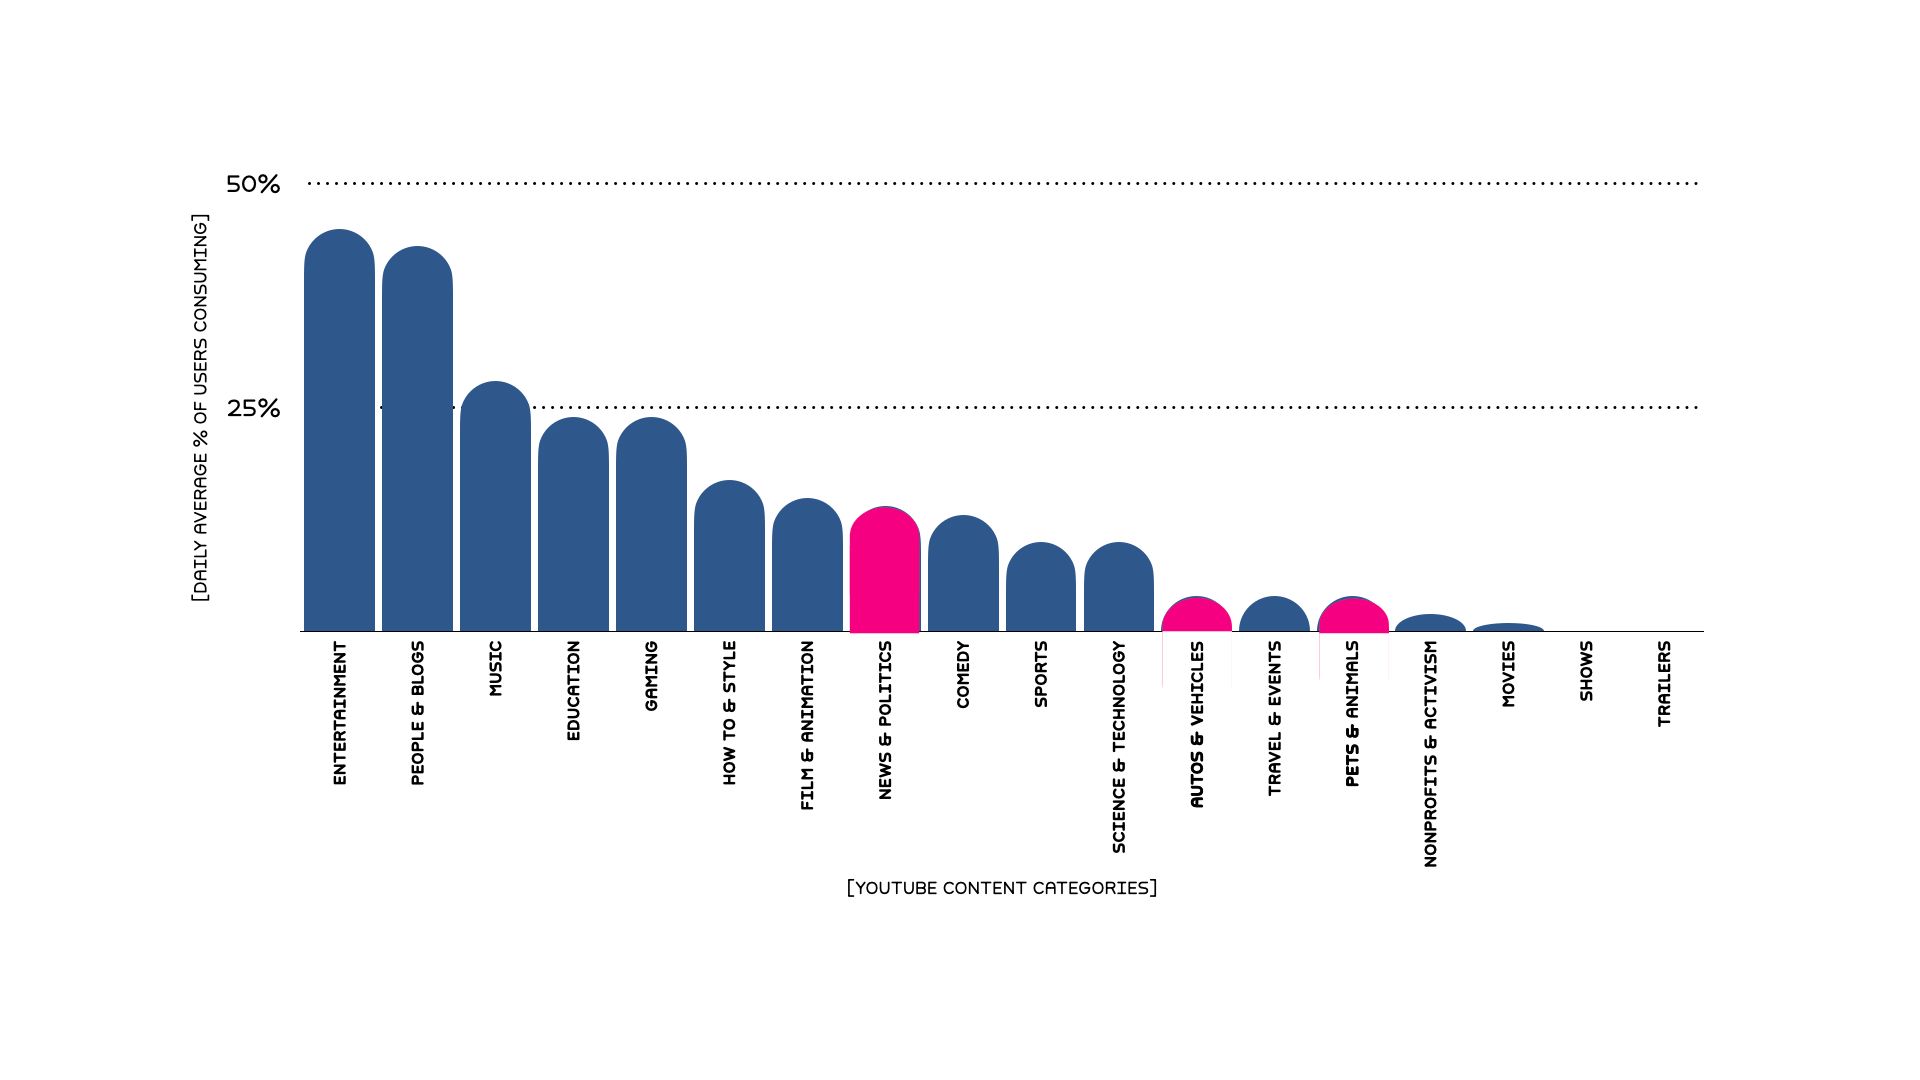
Is the concentration of climate change content in news and politics a problem? Well, if our goal is to engage as many people as possible on climate change, then we probably want to go where people are already engaging, and that may not be news. In fact, news and politics as a content category is not reaching a huge percentage of YouTube users, when compared to, for instance, entertainment. In the visualization below, we shaded pink the categories that tend to carry climate change content, which are clearly not where user density is highest.
Every online platform has its own unique user dynamics. Could it be that YouTube is simply not where news consumers hang out online? Maybe. But when we look at text-based news content and who consumes it on the wider internet, we also see that there is a significant percentage of the population that is simply not engaging. Using our desktop panel data, we were able to estimate that text-based news has a daily average reach of about 29% of people. Using some fancy data analysis explained in the methods section below, when we integrate mobile usage, that number increases to about 60%. But that still means some 40% of people just aren’t engaging with news. This finding jibes with research results from other researchers, like Reuters Institute’s 2022 finding that 42% of Americans actively avoid news at least some of the time. And it means that there are untapped engagement opportunities outside of news and politics for bringing people into a conversation about climate change.
We’re developing new research that can help climate communicators take advantage of this opportunity, and better understand how values-based audiences engage with media generally and, in particular, with the idea of climate change, a viable climate future, and their own agency in helping to bring that future into being.
We used all the news and YouTube content we could match from one week of desktop online consumption: January 1 - January 7, 2023. These data are very big, so sampling a short time period allowed us to look at everything people consumed. Just to give you a sense of how big, in that week, we studied the click-by-click internet consumption of 27,204 adult panelists, 10,444 of whom visited any digital news sites, 9,976 of whom visited YouTube at any time during the week.
We measure “size” of these platforms and of content within a platform as “average daily reach.” That means we calculate reach as users who saw the content divided by total users for each day, and then we take the average over days. This helps to smooth out cycles or regular changes in the data and gives a single estimate of reach that isn’t biased by the fact that people read more news on weekdays, for instance.
Average daily reach of digital news in this sample was 29% and average daily reach of YouTube was 25%. The panel data that allow us to see news and YouTube content—the precise pieces of media people consume—are collected from desktops, so we restricted our analysis to desktop only to afford “apples to apples” comparison. But of course, users might be reading news on their mobile devices. In this study, we used a synthetic device universe based on American Community Survey data about who has which kinds of devices to combine desktop and mobile data and estimate total average daily news reach. Across devices, we believe average daily news reach to be about 60%, and that’s consistent with the Reuter’s finding referenced above. Across devices, we have consistently seen that average daily YouTube reach is between 60% and 70% of adults in the U.S. See, for instance, this report on health narratives.
But the primary focus of this analysis was not to measure platform reach. It was to understand the distribution of climate change content within the set of people who encountered any news or YouTube content.
To measure how much climate change content users might have seen, we matched user experiences on news and YouTube sites to the actual content they consumed. Our news article data come from PeakMetrics, which collects news from around the web every day. We use a database of news rather than a scrape-on-demand approach, because news can be ephemeral, and we want the most complete snapshot of news as it existed during the study period.
Matching the urls that users encountered to the urls at which articles were retrieved, however, is sometimes tricky. We use a custom app that searches for matches between “slugs” (a newspaper term for short summaries connected by hyphens in a url like “1017724-cheesy-hasselback-potato-gratin”) for news domains. For our study period week, we found 43,211 full-text articles consumed at specific urls by 5,391 news consumers. Many more people visited news sites than matched news articles. This is expected, since a large proportion of people on news sites consume headlines exclusively. This analysis only covers articles that we know people actually clicked through to.
We only analyze content we know people clicked through to, even though this approach is “lossy,” because we can’t observe in our data headline skimming as a behavior, and matching urls across databases is hard. The alternative to counting users touching content would be to count articles published on different sites, but article counts tell us virtually nothing about how much “climate change” is actually reaching audiences. A large proportion of news is consumed on aggregators like msn.com and yahoo.com, where recommendation algorithms that customize exposure mean there’s no way to determine which of the many articles that can be found on a site on a given day actually reach any eyeballs.
To determine whether content concerned climate change, we checked text for the phrases “climate change” and “global warming.” There are more expansive ways to do this kind of relevance modeling, and we’ve taken broader approaches based on natural language processing for topics like healthcare and even “climate and natural resources.” Here, we didn’t want to inform a strategy for climate adjacencies like “clean oceans” or “planting trees” though. We wanted to know where people are hearing about climate change, specifically.
1% of all articles users encountered mentioned climate change or global warming. Since users often read more than one article, though, we rolled this up to the average daily reach of climate change: the percent of people who consume any climate change across all their articles. In our study period week, this metric was 3%. If we just use “climate” as a keyword, which picks up some red herrings like “political climate,” reach was 7%.
We’re pretty confident in that value; we even checked the news for the same date range in a completely separate panel recruited and managed by another data partner and found that, across definitions, panels, and metrics, the percent of news consumers reading something about climate change or global warming on a given day was reliably 2 - 4%.
The important question for our analysts and for consumers of this research, though, is “is that big?” The answer is that it’s moderate, and in line with other political issues that are not currently trending. The table below shows the reach of some other keywords in the same week. These keywords are not mutually exclusive, so users who saw something about Democrats and Republicans (at least a third) could have also seen something about climate change.
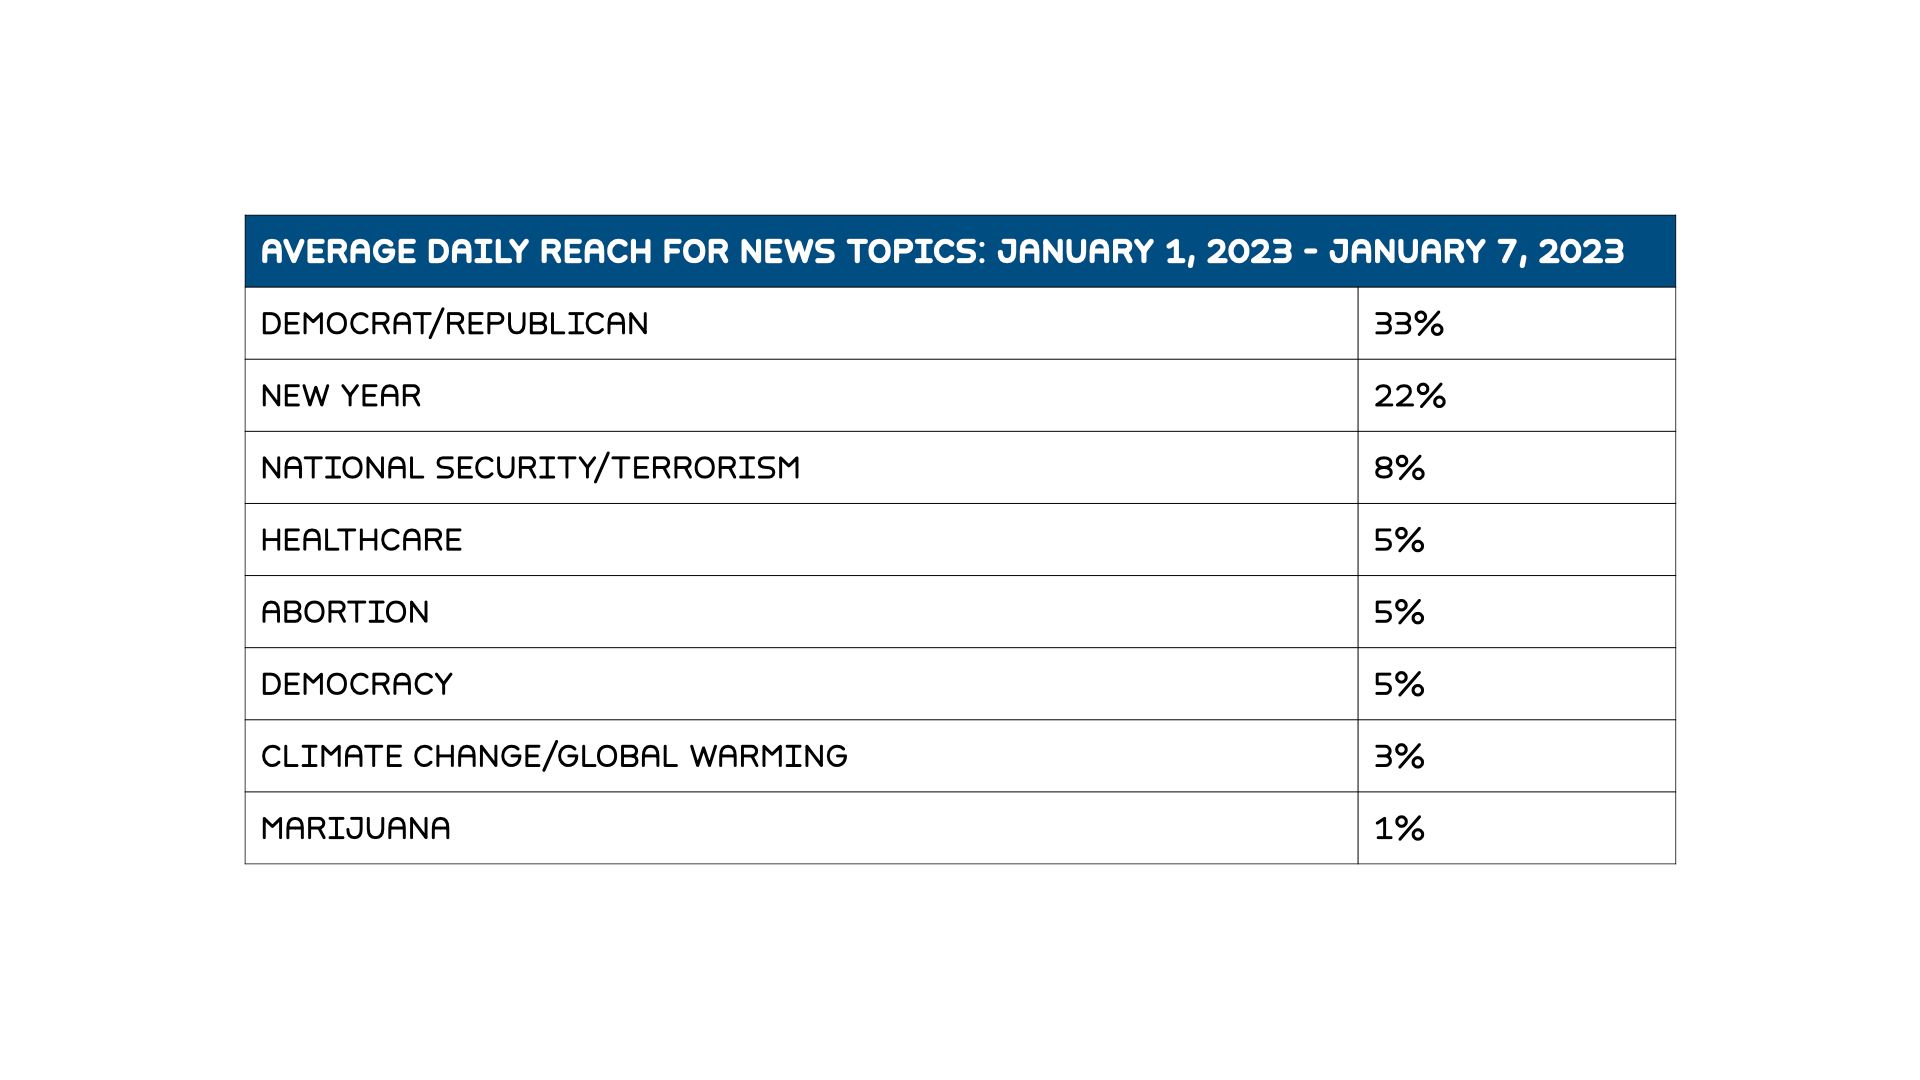
What this table shows us is that (1) a large proportion of people consume news that mentions partisan politics; (2) individual stories that are temporally important like “the new year” surge in reach at specific points in time; and (3) when an issue is not trending, its reach is similar to that of many other top political issues, from healthcare to abortion.
We matched at least one watched video to most YouTube users (9,601). In all, we matched 149, 730 videos from 68,677 channels to their titles, tags, and categories, and to at least one viewing event in the media consumption panel data. Video categories are assigned by video creators when they upload content and, unlike tags, are selected from a relatively short, consistent list, on which categories like “News & Politics” are options. A huge majority of the videos (91%) were only seen by one person in the sample. Two videos, this and this got views from more than 50 people; both covered the same current events story about Damar Hamlin. This type of distribution of content, where some things are huge and mostly everything else is tiny, is typical of social media and affects how we sample content.
We couldn’t transcribe tens of thousands of videos within the scope of this project, so we transcribed a sample of more than 31,000 videos viewed in the first six months of 2023, choosing those which were the most popular. Popularity rather than random sampling gives us more coverage of what people saw because of the huge distribution in reach of individual pieces of media. We chose the most popular videos for the first 5 months of 2023 in several ways though: top 5 videos from each of the 5,000 most popular channels, the top 10 videos per day, the top 2,500 videos for each of the 4 Narrative Observatory audiences, and the top 10,000 videos overall. This approach gives us coverage of top channels, viral individual videos, and the top videos for audiences that don’t use the platform as much.
We analyzed 14,879 transcribed encounters with 5,849 distinct videos watched by 3,630 users. Average daily reach of “climate change” or “global warming” was 1% among these users. The climate reach numbers above reflect average daily reach of climate change content within the category, so that about 7% of News & Politics viewers saw something about climate change in that category while 0% of people watching People & Blogs content saw something about climate change in the category.
Average daily reach of the categories is out of all the users of YouTube. So about 14% of users consumed News & Politics daily, and about 43% consumed People & Blogs content. These numbers add up to more than 100% because a single user might visit more than one category of content in a day.
All research, especially research on administrative data and sampled data like these is subject to limitations. We work to mitigate these limitations to the extent that they might affect our conclusions and recommendations, and we use statistical methods, like bagging and modeling, to verify our core conclusions. But drawing statistical conclusions from very small numbers like these poses some specific mathematical challenges. Keeping these challenges in mind, we cannot conclude, for example, that there is no climate-relevant content in People & Blogs. Rather, our main conclusion here is simply that such content is much, much less common in People & Blogs than in the News & Politics. If you have questions about our methods, or suggestions about how we could improve them, please email us to start a conversation.